
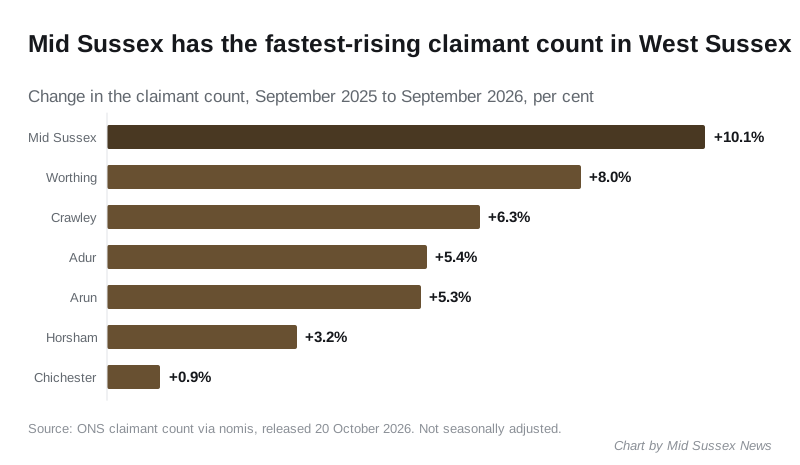
2,075 people in Mid Sussex claimed unemployment-related benefits in September, up 10.1% in a year: the steepest rise of West Sussex's seven districts.
2,075 people in Mid Sussex were claiming benefits principally for being unemployed in September. That is the highest count in the district since August 2021, when the numbers were still coming down from the pandemic peak.
The count rose by 80 in a single month, from 1,995 in August. That is the biggest monthly rise here since February 2025. Over the year it is up 190, or 10.1%, on September 2025.
The Office for National Statistics published the figures on 20 October. The district breakdown is on nomis, the ONS labour market database.
Still low, rising fastest
Mid Sussex remains one of the easiest places in the county to find work. Its claimant rate is 2.1% of residents aged 16 to 64. Only Horsham, on 2.0%, is lower. West Sussex and the South East both stand at 3.1%, and the UK at 3.9%.
But for the second month running, no West Sussex district has seen a faster annual rise. Worthing is next, up 8.0%. Chichester has barely moved, up 0.9%. The county as a whole is up 5.6%, and the UK 2.8%.
| District | Rate | Sept 2026 | Sept 2025 | Change | Annual change |
|---|---|---|---|---|---|
| Crawley | 4.7% | 3,775 | 3,550 | +225 | +6.3% |
| Arun | 3.7% | 3,490 | 3,315 | +175 | +5.3% |
| Worthing | 3.3% | 2,305 | 2,135 | +170 | +8.0% |
| Chichester | 3.2% | 2,325 | 2,305 | +20 | +0.9% |
| Adur | 3.1% | 1,175 | 1,115 | +60 | +5.4% |
| Mid Sussex | 2.1% | 2,075 | 1,885 | +190 | +10.1% |
| Horsham | 2.0% | 1,790 | 1,735 | +55 | +3.2% |
Crawley’s rise of 225 is larger in raw numbers. It starts from a much bigger base, so in percentage terms it is growing at about three fifths of the Mid Sussex rate.
Who is claiming
The rise is spread across every age group, according to the same nomis age breakdown. Compared with September 2025:
- 18 to 24: 340, up from 300 (+13.3%)
- 25 to 49: 1,180, up from 1,090 (+8.3%)
- 50 and over: 560, up from 495 (+13.1%)
The youngest and the oldest groups are rising faster than the middle. Men make up 1,100 of the total and women 980.
ONS rounds district figures to the nearest five, so the age groups do not add exactly to the total.
A revision to August
ONS has revised the August figure for Mid Sussex down to 1,995. The first estimate, published in September and reported here at the time, was 2,025. Revisions of this size are routine: late claims and corrections are added as they come in. The trend is unchanged. On the revised figures the count has now risen in each of the last three months.
What the claimant count measures
It counts people claiming Jobseeker’s Allowance, plus Universal Credit claimants who are required to look for work. It is not the unemployment rate. Some people on Universal Credit who are in low-paid work are included. Some people who are out of work but not claiming are not.
The figures here are not seasonally adjusted, which is why we compare September with September rather than with August alone.
What it means for you
If you have lost work or had your hours cut, the claimant count is a reminder that you are not alone, and that help exists:
- Universal Credit can be claimed online at GOV.UK.
- Jobcentre Plus contact details and opening hours are on GOV.UK.
- Council tax support is run by Mid Sussex District Council. Check your band and the current charges on our council tax page.
We will report the October figures when ONS publishes them in November.
Have your say