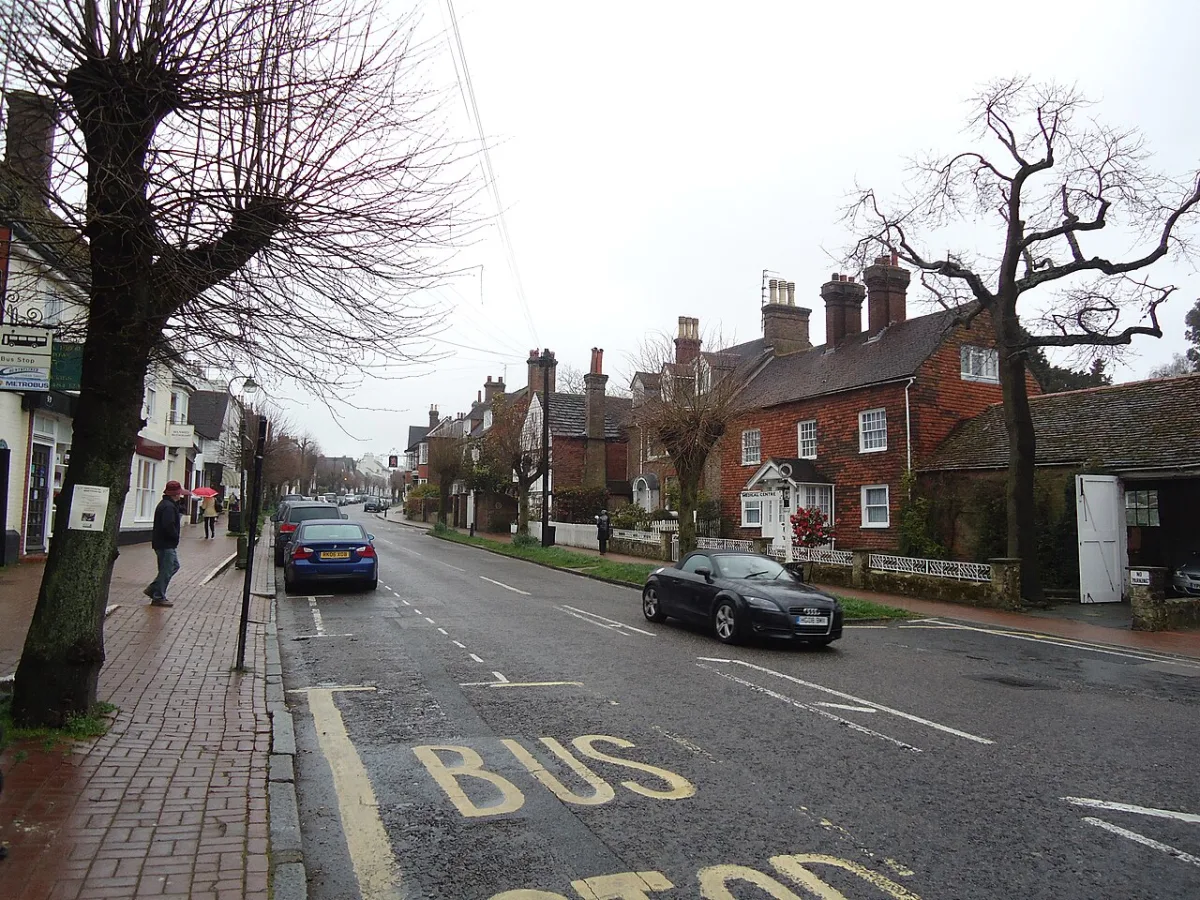

The average Mid Sussex home sold for £430,711 in May 2026, up 0.4% in a year. Median sold prices for all 25 wards, and why one of them looks far cheaper than it is.
The average home in the Mid Sussex district sold for £430,711 in May 2026, the most recent month published in the official UK House Price Index. That is up 0.4% over twelve months and down 0.7% on the month before, so the district is flat rather than falling or climbing.
The district figure is the least useful number on this page, because Mid Sussex is not one housing market. It is three towns of similar size that price very differently, a ring of Wealden villages that price higher than all of them, and a large stock of town-centre flats that pulls the averages about. Below the headline, the gap between the dearest and cheapest parts of the district is a factor of 2.6.
Mid Sussex against West Sussex and England
| Area | Average price, May 2026 | Change over 12 months |
|---|---|---|
| Mid Sussex | £430,711 | +0.4% |
| South East | £381,311 | +1.2% |
| West Sussex | £374,551 | +0.3% |
| England | £292,095 | +2.3% |
Mid Sussex sits 15% above the West Sussex average and 47% above England. That premium is a commuter premium: the Brighton main line runs down the middle of the district, and Haywards Heath is 43 minutes from London Victoria. What you are paying for is largely the train service.
Note the direction of travel, though. England rose 2.3% over the year while Mid Sussex managed 0.4%. Expensive commuter districts have been the slowest part of the market since mortgage rates rose, and this one is no exception.
What you pay by property type
These are the district averages for May 2026 from the UK House Price Index:
- Detached: £732,193, up 0.4% over the year.
- Semi-detached: £451,684, up 1.7%, the strongest of the four.
- Terraced: £366,762, up 0.8%.
- Flats and maisonettes: £218,837, down 2.1%, the only category falling.
A detached house in Mid Sussex costs 3.3 times a flat. That spread matters more here than in most districts because Haywards Heath, Burgess Hill and East Grinstead all have substantial blocks of flats near their stations, so a ward can look cheap purely because of what sold there rather than what it is like.
The index also splits buyers. A first-time buyer paid an average of £326,062 in May 2026, up 0.3% over the year. A former owner-occupier, someone selling one home to buy another, paid £541,083. The £215,000 gap between those two figures is the size of the step from a first flat or terrace to a family house in this district.
Median sold price by ward
The figures above are mix-adjusted averages for the whole district. To see inside it, we pulled every residential sale registered with HM Land Registry in the RH15, RH16, RH17, RH19 and BN6 postcode areas for the year to 30 June 2026, looked up each postcode on postcodes.io to find which council area and ward it falls in, and kept only the 1,852 sales inside Mid Sussex. Sales that fell into Lewes, Wealden or Tandridge are excluded.
The district-wide median from those 1,852 sales is £425,000. Here is how it breaks down.
The trap in that chart, and how to read round it
East Grinstead Town is not the cheap part of the district. Its £240,000 median is the lowest of the 25 wards by a wide margin, but 76 of its 123 sales in the year were flats, at a median of £222,066. The 21 detached houses that sold in the same ward had a median of £615,000, which would put it third in the district. The ward is not cheap. It just sells a lot of flats, because that is what the town centre is made of.
The same effect runs through Haywards Heath. Lucastes and Bolnore shows £331,250 and Bentswood and Heath £332,000, the two lowest medians after East Grinstead Town, but in Lucastes and Bolnore 66 of 116 sales were flats and the detached median was £695,000. Meanwhile Haywards Heath North, which sells almost no flats, shows £552,000.
If you are comparing areas, compare like with like:
| Ward | Detached median | Flat median | All types |
|---|---|---|---|
| Lindfield | £890,000 | £285,000 | £617,500 |
| Cuckfield, Bolney & Ansty | £780,000 | £275,000 | £625,000 |
| Haywards Heath Lucastes & Bolnore | £695,000 | £275,000 | £331,250 |
| East Grinstead Town | £615,000 | £222,066 | £240,000 |
| Haywards Heath Bentswood & Heath | £537,500 | £243,000 | £332,000 |
| Burgess Hill Leylands | £497,500 | £180,000 | £355,000 |
Read down the detached column and the district makes sense: the Wealden villages first, then the north of Haywards Heath, then the towns, with Burgess Hill last.
Where the towns actually sit
Burgess Hill is the cheapest of the three towns to buy a house in. Its five wards run from £355,000 to £452,500, and not one of them reaches the district average. That is the town’s history showing up in its stock: it grew fast and recently, with a lot of post-war and modern estate housing rather than period property.
Haywards Heath splits in two. North of the town, £552,000. The station side and Bolnore Village, both heavy in flats and newer terraces, around £331,000. The difference between those two figures is essentially the difference between a village and a commuter town in a single postcode.
East Grinstead is the most mixed. Imberhorne at £462,500 and Ashurst Wood and East Grinstead South at £485,000, against a town-centre ward of £240,000 that is mostly flats. It is also the town where a house buyer gets the most for their money relative to a season ticket, since an East Grinstead annual season to London costs £2,300 a year less than one from Haywards Heath.
Why prices are flat, and what happens next
The stall is not local. Higher mortgage costs since 2023 have taken the heat out of the expensive commuter belt everywhere, and Mid Sussex is at the expensive end of it. Flats are the only category actually falling, down 2.1% over the year, which is what you would expect when the buyers most exposed to monthly interest costs are the ones buying them.
Supply is the thing to watch. The district’s Local Plan is being rewritten, and the planning inspector has pushed the housing requirement up from 19,620 homes to 24,071 over the plan period, with 35 additional sites now out for public consultation. Roughly 4,000 homes’ worth of those new allocations land in and around the villages rather than in the towns. What that does to village prices over the next decade is the open question. The detail is on our Mid Sussex planning page.
Where these numbers come from
- District averages and annual change: the UK House Price Index for Mid Sussex (GSS code E07000228), May 2026, published by HM Land Registry and the ONS. This is mix-adjusted, so it corrects for the type of property sold.
- Ward medians and by-type figures: our own analysis of HM Land Registry Price Paid data for the year to 30 June 2026, restricted to the 1,852 sales whose postcode falls in Mid Sussex. These are raw medians, not mix-adjusted.
- Asking-price averages published by property portals are typically much higher than either figure, because they measure what sellers want rather than what buyers paid. Always check which area and which property mix a number refers to before comparing.
Have your say