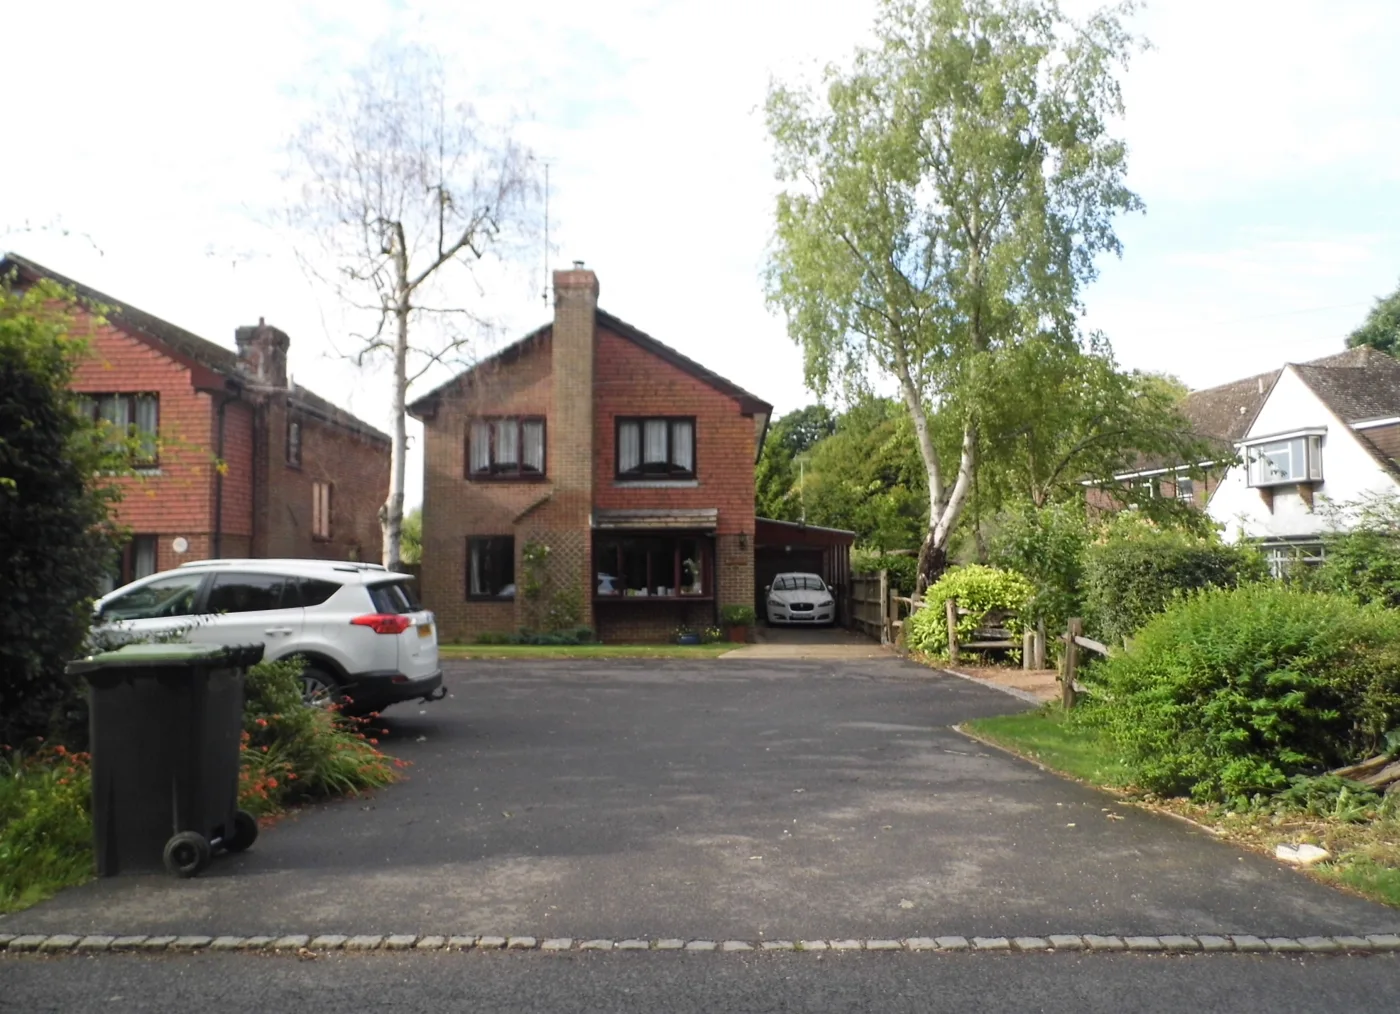

The average Mid Sussex home gained £3,514 in July to £430,777, ending a two-month slide. Flats are down 2.6% on the year while semi-detached houses are up 0.9%.
The average Mid Sussex home was worth £430,777 in July 2026, up £3,514 on June and down 0.2% over twelve months, according to the UK House Price Index published by HM Land Registry.
That 0.8% monthly rise ends a two month slide. Prices here fell 1.1% in May and 1.4% in June. The district is still worth less than it was a year ago, but the drop has stopped.
Two things to hold in mind before reading anything into the number. The UKHPI average is a mean, not a median, so a handful of expensive sales moves it. And the index is revised: June was first published at £426,441 and has since been revised up to £427,263, a difference of £822 in a single month’s figure.
The district is still £10,587 below its October peak
The clearest way to read Mid Sussex is over thirteen months rather than one.
Prices peaked at £441,364 in October 2025. They then fell in five of the next eight months, bottoming at £427,263 in June. July’s £430,777 is:
- £10,587 below the October 2025 peak
- £952 below July 2025, when the average was £431,729
- £3,514 above June 2026
A year ago Mid Sussex was rising at 2.2% a year. It is now falling at 0.2%.
Flats are doing the damage
The district average hides four very different markets.
| Type | July 2026 average | Annual change |
|---|---|---|
| Detached | £732,782 | -0.3% |
| Semi-detached | £451,606 | +0.9% |
| Terraced | £368,343 | +0.5% |
| Flat or maisonette | £217,740 | -2.6% |
Semi-detached and terraced homes are both up on the year. Detached homes are almost flat. The fall in the district average is coming from flats, which are down 2.6%.
The index numbers make the gap starker. Land Registry sets each type to 100 in January 2023. On that measure semi-detached homes now stand at 101.6 and terraced at 101.1, both above where they started. Flats are at 95.0.
A detached home in Mid Sussex now costs about 3.4 times what a flat costs.
The first-time buyer average is £325,959, down 0.2% on the year. That is almost exactly the same annual movement as the district as a whole, so the entry level has not become any easier relative to everything else.
How Mid Sussex compares with its neighbours
Mid Sussex is the third dearest of the seven West Sussex districts, and it is the gap between the monthly and annual columns that tells the story this month.
| District | July 2026 average | Monthly | Annual |
|---|---|---|---|
| Horsham | £441,654 | +1.1% | +0.7% |
| Chichester | £432,078 | -0.1% | -1.4% |
| Mid Sussex | £430,777 | +0.8% | -0.2% |
| Adur | £380,120 | +0.2% | +1.3% |
| Crawley | £332,384 | -2.1% | +2.3% |
| Arun | £321,460 | -0.1% | +0.9% |
| Worthing | £297,200 | 0.0% | -3.9% |
Last month Mid Sussex had the steepest monthly fall of the seven. This month it has the second strongest monthly rise, behind Horsham.
Crawley is the odd one out. It fell 2.1% in July, the sharpest drop in the county, and it is still up 2.3% over the year, the strongest annual figure in West Sussex. Worthing is the mirror image: flat on the month, down 3.9% on the year.
For wider context, West Sussex as a whole averaged £373,740 in July, up 0.1% on the month and down 0.1% on the year. The South East averaged £380,878 and England £293,479. England is up 1.1% over twelve months, so Mid Sussex is running behind the national picture.
What it means for you
- If you are selling, the two month slide has stopped, but the district is still worth £10,587 less than it was last October. A valuation from the autumn of 2025 is out of date.
- If you own a flat, your part of the market is the weak one: down 2.6% on the year, and the only type still below its January 2023 index level.
- If you are buying a house rather than a flat, semi-detached and terraced prices have both edged up over the year. That is where the competition is.
- Do not read your own street off this number. UKHPI is a mean across the whole district, from Hassocks to East Grinstead, and it gets revised for months afterwards. June’s figure moved by £822 between publications.
- Check the actual sold prices for your road on the Land Registry’s price paid data before making a decision. Our Mid Sussex house prices page explains how the index works and where the raw sales are published.
We covered the June figures when Mid Sussex recorded the steepest monthly fall in West Sussex. The next release, covering August, is due in October.
Sources
- HM Land Registry UK House Price Index, Mid Sussex, July 2026, and the seven West Sussex districts, West Sussex, the South East and England, all read from the Land Registry’s open data on 22 September 2026: landregistry.data.gov.uk
Have your say